Nifty 50 Index Analysis: Navigating the Current Market Landscape
Nifty 50 Index Analysis: Key Insights and Trading Strategy
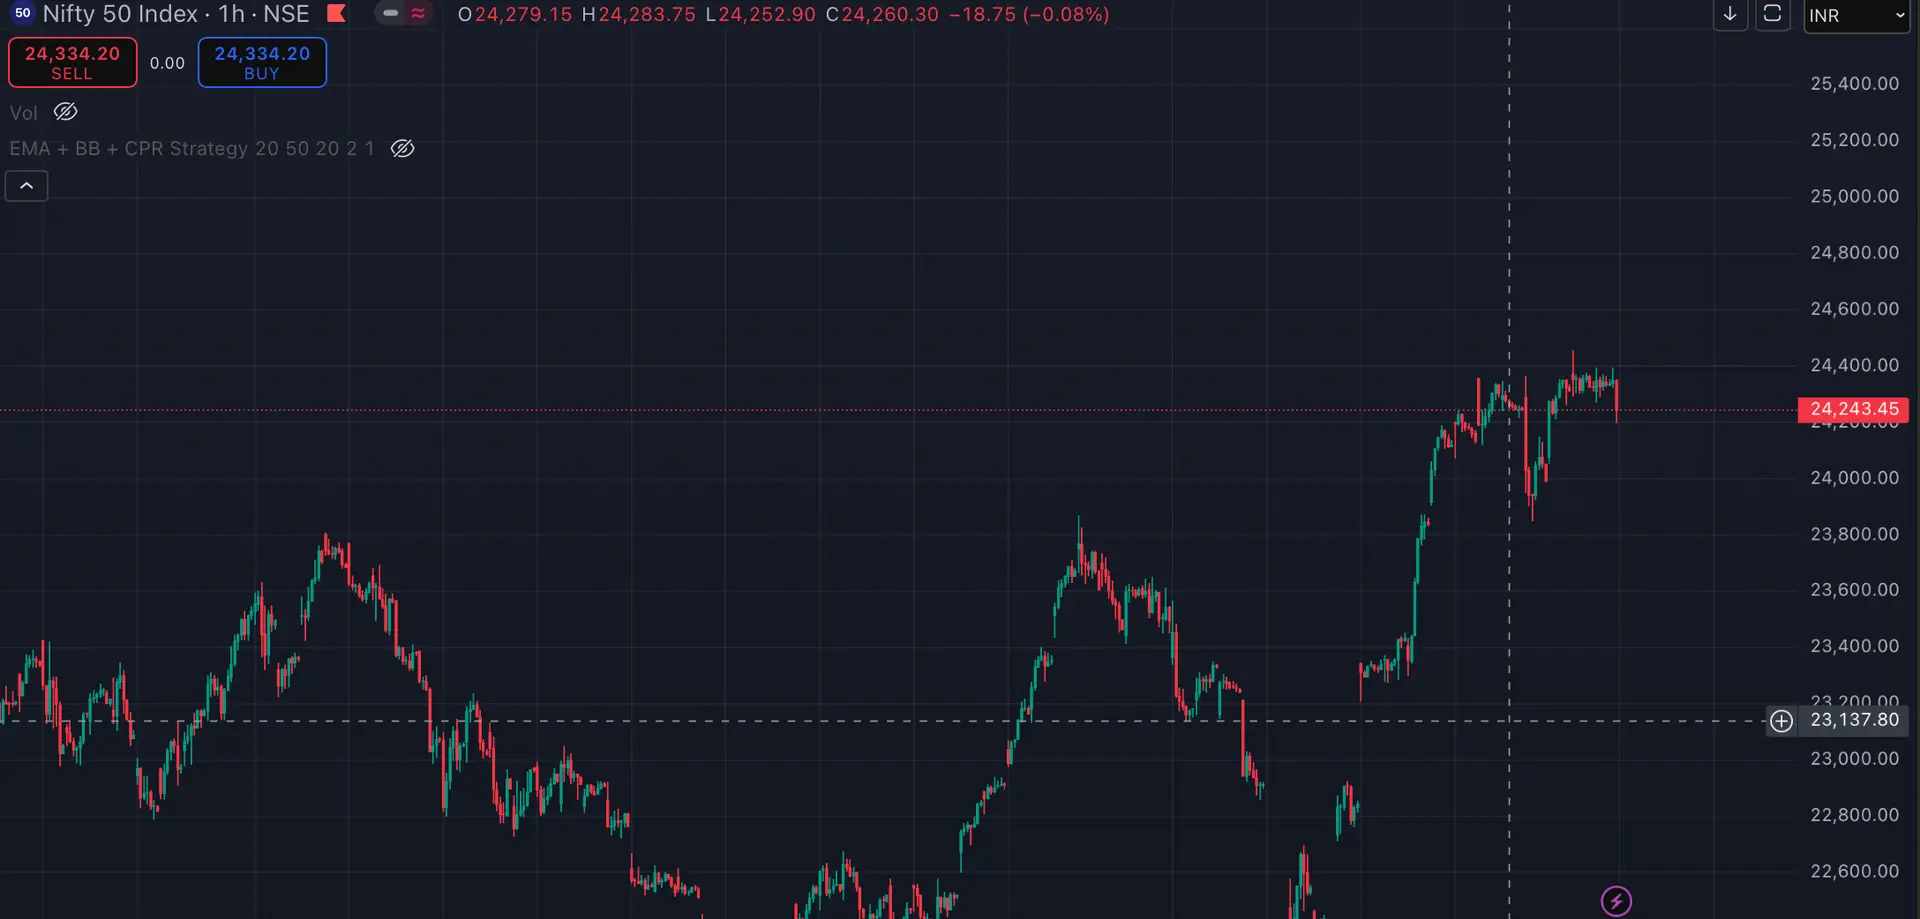
The Nifty 50 Index is currently in a consolidation phase after a strong upward rally. Below is a detailed analysis of the chart and actionable insights for traders and investors.
Current Market Overview
- Current Price: 24,243.45
- Daily Change: -18.75 points (-0.08%)
- Key Levels:
- Resistance: 24,400
- Support: 23,137.80
The index is trading slightly below the critical resistance level of 24,400, indicating a potential pause in the bullish momentum.
Technical Analysis
1. Trend Analysis
- The chart shows a strong uptrend from the 23,000 level, with higher highs and higher lows.
- However, the price is now consolidating near the resistance zone of 24,400, suggesting indecision among market participants.
2. Key Indicators
- EMA (Exponential Moving Average): The price is trading above the 20-period EMA, confirming the bullish trend.
- Volume: Low volume indicates a lack of strong buying or selling pressure, which is typical during consolidation phases.
3. Support and Resistance
- Immediate Resistance: 24,400 – A breakout above this level could trigger further upside momentum.
- Strong Support: 23,137.80 – This level has acted as a base for the recent rally and is a critical level to watch for downside protection.
4. Risk-Reward Ratio
- Risk to Support: ~1,100 points
- Reward to Resistance: ~150 points
- Risk-Reward Ratio: 0.13 – Indicates limited upside potential in the short term.
Market Sentiment
- The market appears to be in a neutral to slightly bullish phase, with traders waiting for a breakout or breakdown from the current range.
- The low volatility suggests that the index is in a consolidation phase, which often precedes a significant move.
Trading Strategy
For Short-Term Traders:
Breakout Trade:
- Enter long positions above 24,400 with a target of 24,600–24,800.
- Place a stop-loss below 24,200 to manage risk.
Buy on Dips:
- Look for buying opportunities near the support level of 23,800–24,000.
- Target the resistance zone of 24,400.
For Long-Term Investors:
- Maintain a bullish outlook as long as the index stays above the 23,137.80 support level.
- Use dips as opportunities to accumulate positions.
Conclusion
The Nifty 50 Index is at a critical juncture, consolidating near its resistance level of 24,400. A breakout above this level could lead to further upside, while a breakdown below 24,000 may signal a short-term correction. Traders should remain cautious and use tight stop-losses to manage risk.
Pro Tip: Keep an eye on volume and momentum indicators for confirmation of the next directional move. A surge in volume during a breakout or breakdown will provide stronger conviction for the trade.